In today’s trading session, Power Grid Corporation of India (NSE: POWERGRID) witnessed a significant technical breakout, presenting an attractive trade opportunity for F&O (Futures & Options) traders. The stock has shown a clear shift in market structure, signaling potential upside in the coming sessions.
Power Grid Trade Analysis: Breakout Above ₹310 Signals Bullish Momentum
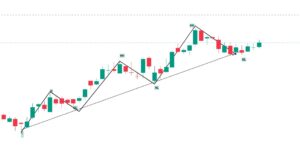
Power Grid had been trading in a lower-high, lower-low structure over the past few days, indicating a prevailing downtrend. However, this pattern changed today with the stock reversing its trend to form a higher-high on the 1-hour chart.
Notably, the stock closed above the ₹310 resistance level, finishing the session at ₹311.10. This breakout suggests a shift in momentum, with the previous resistance zone now acting as support. This change in structure is considered a strong signal for a potential bullish move.
Trade Levels to Watch
For traders looking to enter this setup, the key levels are as follows:
| Parameter | Value |
|---|---|
| Entry Price | ₹311.10 |
| Stop Loss | ₹301 |
| Target | ₹332.25 |
The risk-to-reward ratio for this trade comes out to approximately 1:2.1, making it an attractive proposition for those seeking upside with defined risk.
Why This Trade Setup Stands Out
Several factors make this trade setup noteworthy:
Structural Shift: On the daily timeframe, Power Grid has transitioned into a strong bullish trend as it consistently forms higher highs and higher lows. This is a key technical pattern that indicates increasing buying pressure and the market’s willingness to push prices upward.A higher high occurs when the stock price surpasses the previous peak, signaling that the bulls are in control and are pushing the price to new levels. In the case of Power Grid, the recent price action has seen the stock break above previous resistance points, creating new highs. This is a classic signal of a trend reversal or continuation to the upside.
Breakout Above Key Resistance: Power Grid has successfully broken through and closed above the significant resistance level at ₹310. This breakout is crucial as it marks a shift in the stock’s price dynamics. What was once a strong resistance zone is now expected to act as a key support level. A retest of ₹310 in the coming sessions could provide an opportunity for traders to enter long positions, as any price pullbacks towards this level are likely to face buying interest, reinforcing the bullish trend. This technical shift increases the probability of further upward movement, with the newly established support level offering a safety net for any potential price dips.

Volume Confirmation: The breakout was accompanied by higher-than-usual trading volumes, further confirming the strength of the move.
Futures OI Data: Open interest (OI) data from the F&O segment indicates a fresh buildup of long positions, suggesting a bullish sentiment among traders.
Sector Strength: The power sector as a whole showed relative strength today, further supporting the positive outlook for Power Grid.
Given these factors, there is a high probability that the stock could continue its upward momentum towards the next resistance zones.
Options Strategy: Bull Call Spread
For options traders looking to capitalize on this breakout with a defined risk, a bull call spread strategy is recommended:
Buy POWERGRID 310 CE at ₹10.6
Sell POWERGRID 320 CE at ₹5.3
Max Profit
= ₹10 – ₹5.3
= ₹4.7 per share
Max Loss
= ₹5.3 per share
Break-even
= ₹310 + ₹5.3
= ₹315.3
This strategy allows traders to participate in the potential upside while limiting risk exposure. The maximum profit is capped, but so is the maximum loss, making it a suitable choice for those expecting moderate upward movement without excessive volatility.
For more aggressive traders, buying the 310 CE outright can offer higher rewards, though with increased risk.
Key Levels for Monitoring
Support Levels: ₹310 (acting as new support), ₹301
Resistance Levels: ₹320, ₹332
If Power Grid maintains its position above ₹310 and sustains the breakout, the next targets will be ₹320 and ₹332.
Market Outlook
The breakout above ₹310 and the shift in price structure indicate a bullish outlook for Power Grid in the short term. Traders can position themselves for a move towards the next resistance levels, but should remain vigilant of any price reversal or signs of weakness.
As always, traders are advised to implement sound risk management strategies and trade with a clear plan. The market is dynamic, and while technical setups provide a strong foundation, no trade is without its inherent risks.
Conclusion
The Power Grid breakout above ₹310 marks a key moment in its price action, and traders with a bullish view can look to target levels around ₹320 and ₹332. The combination of structural shift, breakout, volume, and OI data supports the case for further upside.
Disclaimer:
The information provided in this article is for educational and informational purposes only. It is not intended as investment advice or a recommendation for any particular strategy, stock, or financial product. Stock market investments are subject to market risks. Please consult a qualified financial advisor before making any investment decisions. The author and the website are not responsible for any losses incurred based on the content presented above.
As per the guidelines set by the Securities and Exchange Board of India (SEBI), please ensure compliance with all applicable regulations and laws while trading in the Indian financial markets.